
Prof Charles Pattie
Professor of Politics, University of Sheffield
Email: c.pattie@sheffield.ac.uk
UK Election 2024
Section 2: Voters, polls and results
13. Forecasting a multiparty majoritarian election with a volatile electorate (Dr Hannah Bunting)
14. The emerging infrastructure of public opinion (Dr Nick Anstead)
15. A moving target? Voter segmentation in the 2024 British General Election (Prof Rosie Campbell)
16. Don’t vote, it only encourages them? Turnout in the 2024 Election (Prof Charles Pattie)
17. Cartographic perspectives of the 2024 General Election (Prof Benjamin Hennig)
18. Gender and vote choice: early reflections (Dr Ceri Fowler)
19. Changing Pattern amongst Muslim voters: the Labour Party, Gaza and voter volatility (Dr Parveen Akhtar)
20. Religion and voting behaviour in the 2024 General Election (Dr Ekaterina Kolpinskaya, Dr Stuart Fox)
21. Failure to connect: the Conservative Party and young voters (Dr Stephanie Luke)
22. Youthquake for the progressive left: making sense of the collapse of youth support for the Conservatives (Prof James Sloam, Prof Matt Henn)
23. Values in the valence election (Prof Paula Surridge)
24. Tactical voting: why is it such a big part of British elections? (Thomas Lockwood)
Before a single vote was cast, conditions already seemed set for an unusually low turnout at the UK’s 2024 General Election. Since Boris Johnson’s defenestration and the collapse of the ill-fated Liz Truss premiership, Labour’s poll lead over the Conservatives had been very large and steady. It persisted almost unchanged throughout the campaign itself. Furthermore, the overheated election debate notwithstanding, the gap between the Labour and Conservative (the two main contenders for government) ‘retail offers’ was smaller than either claimed. Both factors reduce the incentives to vote in any election. When similar conditions held in previous elections – most notably in 1997 and 2001, when New Labour seemed sure to win (and retain) large majorities while being seen as not so very different from their Conservative opponents – turnout had been lower than in previous elections (substantially so in 2001).
And so it proved. Only 60% of all registered electors voted in 2024. As figure 1 shows, this was well below not only the long-run average for UK general elections since 1918 (the solid red line), but also the lower 95% confidence interval around that average (the dotted red lines) – a mark of just how unusually poor it was. Over the last century or so, turnout has been lower than in 2024 only twice – in 1918 and in 2001.
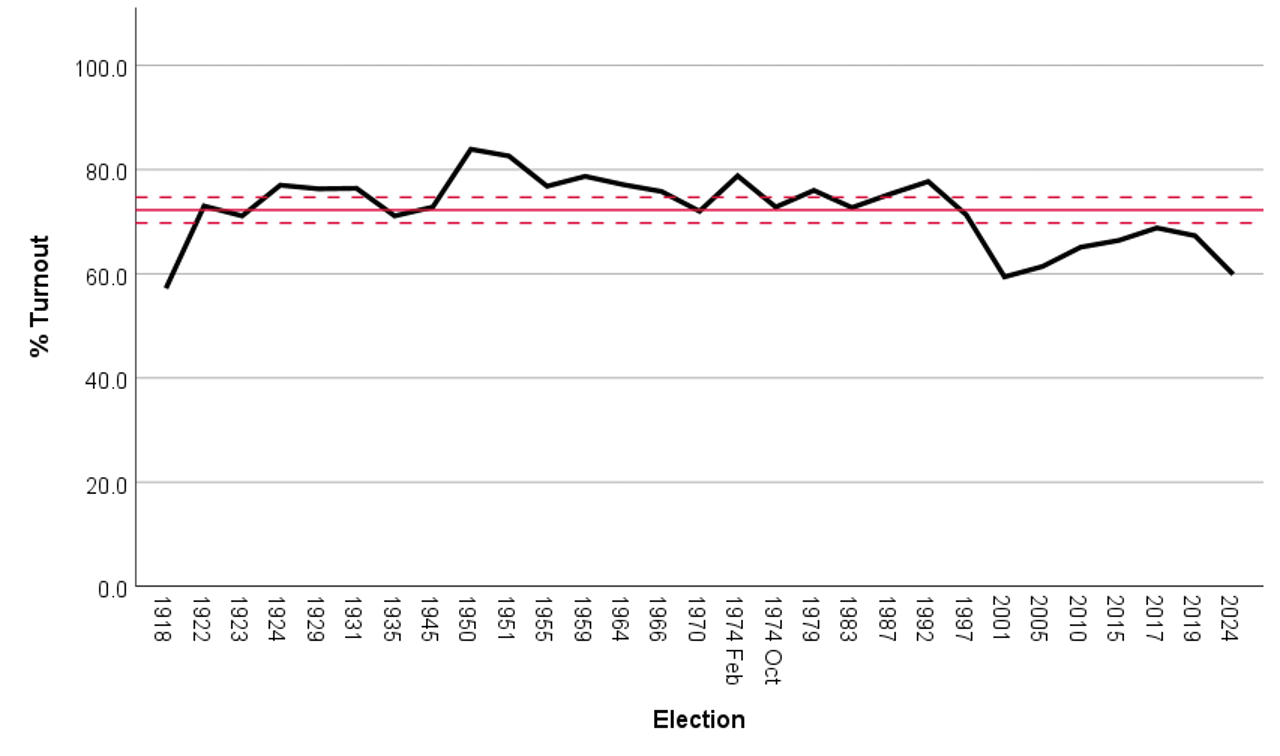
Figure 1: UK General Election Turnout, 1918-2024
What is more, the sharp fall in turnout between 2019 and 2024 effectively cancelled out the slow improvement in electoral participation at most elections after the previous low point in 2001, when only 59% voted. Turnout rose at the next two elections, reaching 69% in 2017 before dropping slightly in 2019 to 67%. But in 2024 it plunged back to a level only marginally higher than in 2001.
At the constituency level in 2024, turnout ranged from 40% in Manchester Rusholme to 76% in Richmond Park. Its geography was largely similar to past elections (figure 2). Where turnout had been relatively high previously, it remained so in 2024: where it had previously been low, it was still low. That geography largely mirrored the UK’s economic geography: voters in more affluent, middle-class communities tended to turn out at higher rates than their peers in less affluent communities.
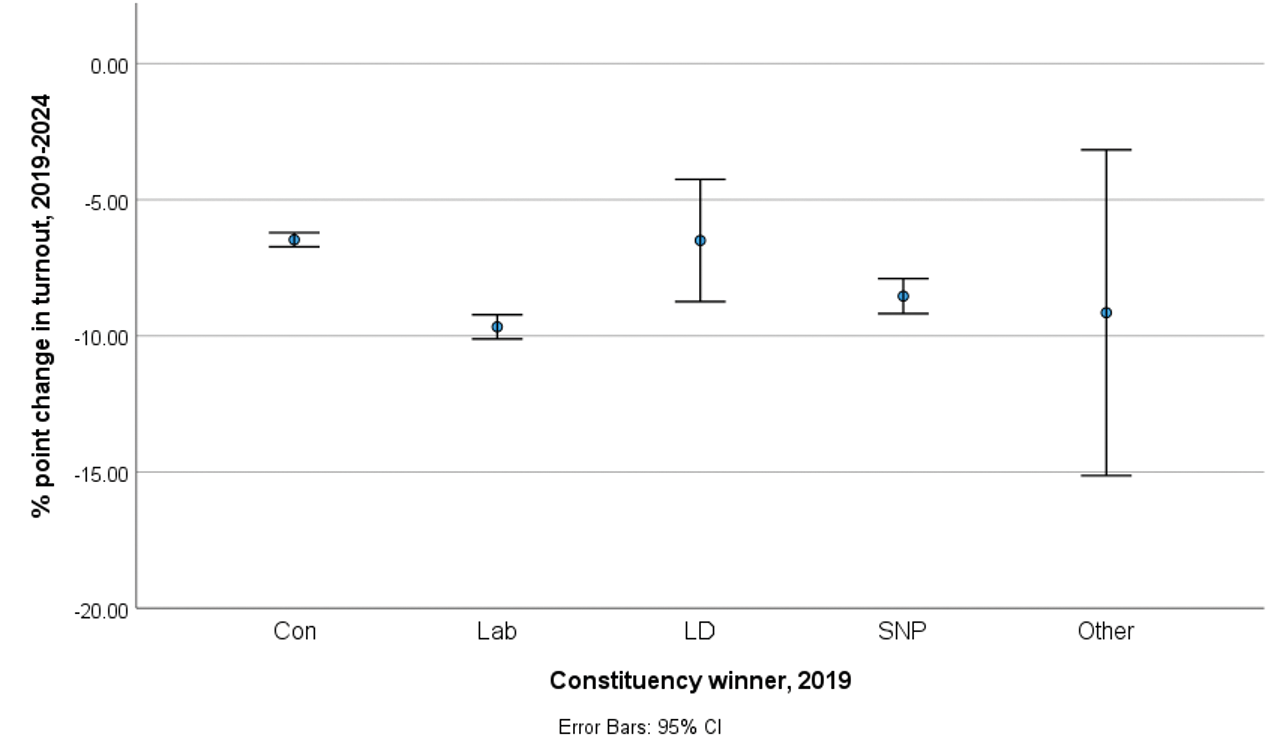
Figure 2: Constituency turnout in 2019 and 2024 compared
That said, turnout fell in almost all constituencies (it rose – by miniscule amounts – in only four seats). But it did not decline uniformly. Figure 3 shows the average percentage point fall in turnout between 2019 and 2024 in seats held by the Conservatives, Labour, the Liberal Democrats, the SNP, and all other parties combined. The circles represent the average decline, and the bars on either side the 95% confidence intervals around those averages. Because we are looking at falls in turnout, the lower the average dot on the graph, the larger the decline. On average, turnout fell more in Labour-held seats (down 9.7 % points) than in seats defended by the Conservatives or the Liberal Democrats (both down 6.5 % points). And closer inspection shows that it fell more in seats Labour held in both elections (down on average by 9.7 % points) than in seats Labour took from other parties in 2024 (where the average decline was 7.8 % points). This suggests that one factor, over and above the depressing effect of a widely expected landslide, was campaign mobilisation. In 2024, the major parties expended little effort in turning out votes in Labour-held seats as these were widely expected to remain Labour (hence the large drops in turnout there). Instead, they all focused their efforts on seats (many previously considered safe) defended by the Conservatives, where Labour and the Liberal Democrats hoped to make substantial gains, and the Conservatives tried to stem their losses – hence the lower falls in turnout there.
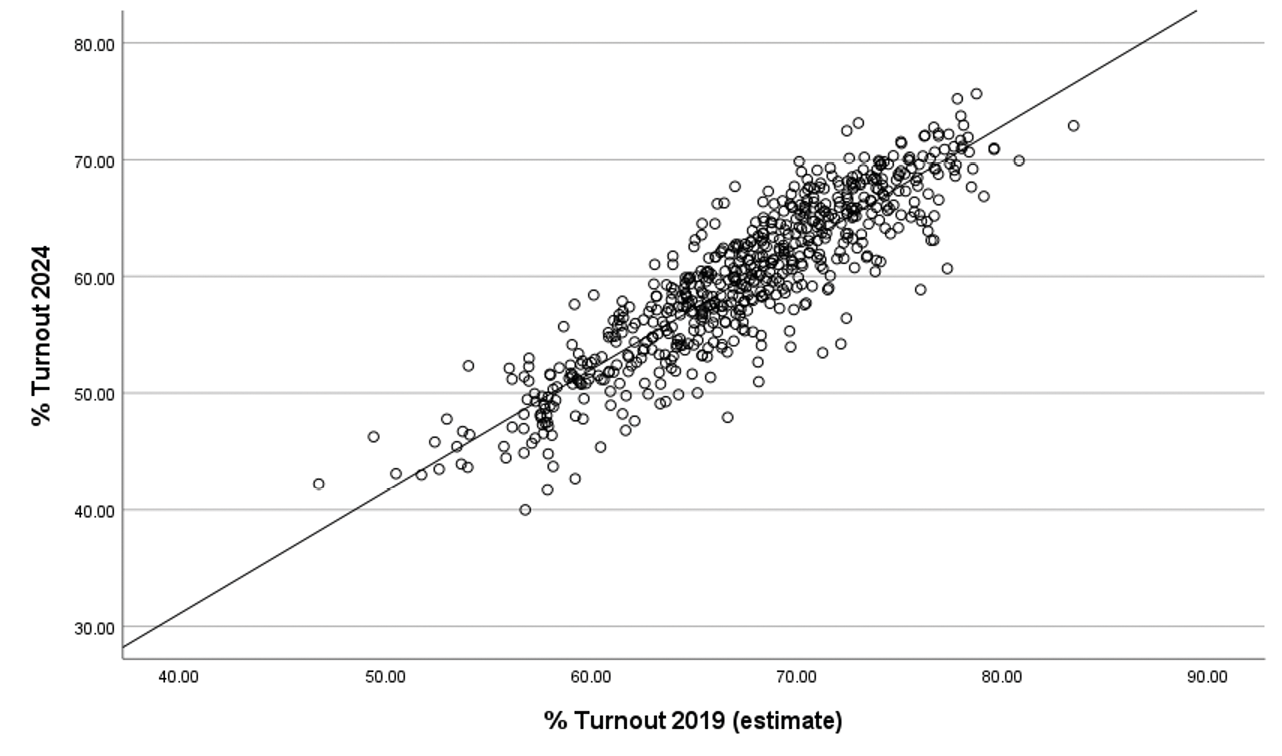
Figure 3: Percentage point change in constituency turnout, 2019-2024, by constituency winner 2019
Was the decline in turnout experienced at the 2024 Election exceptional? In one sense, no. The overall fall in turnout from 2019 to 2024 was 7.4 % points. That is similar to the fall experienced in the last landslide defeat of a long-serving Conservative government: between 1992 and 1997, when it fell by 6.4% points. That size of decline is more or less in line with what we might expect given the size and persistence of Labour’s pre-election poll leads at both elections. Overall turnout was lower than in 2024 than in 1997 not because of the size of the anticipated landslide, in other words, but because the previous ‘high’ in 2019 was considerably below the ‘high’ in 1992.
But in another sense, 2024 is more troubling. While the election looks like 1997 in terms of the size of the new government’s landslide, in other ways it looks very different. New Labour took power in 1997 on a tide of optimism, inherited a strong economy, and had the support of around 42% of voters. Keir Starmer’s government faces a much more challenging situation. That is reflected in the turnout figures at recent elections. While the fall in turnout is similar at both the 1997 and 2024 contests, the turnout level in 1997 was within the 95% confidence interval around the long-term average since 1918: it was not unusual. Since the early 2000s, however, turnout at every election has been below the lower bound of the confidence interval. Compared to the 20th century, British politics seems stuck in a rut of relatively low electoral participation rates. Historically low turnout seems to be the new normal and (unless the new government can raise trust in government) that looks unlikely to change – a worrying prospect for those concerned about the health of our democracy.